Menu Engineering 2.0: Use AI Images to Guide High-Margin Choices
Menu Engineering, Updated: How Images Steer Choices
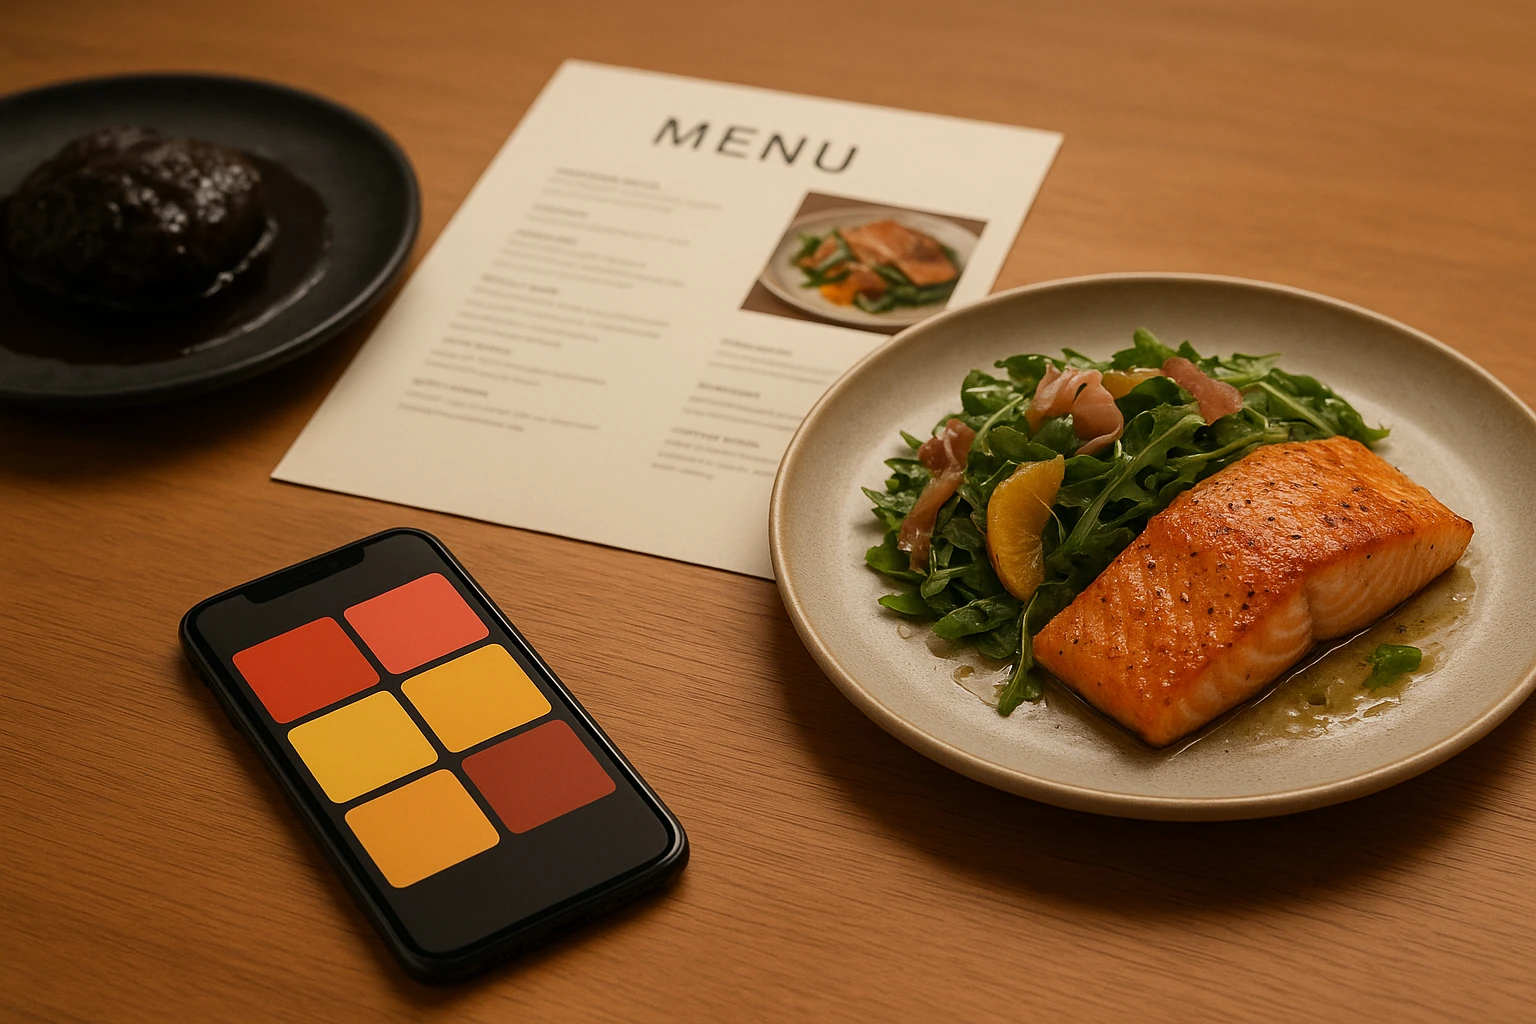
If you’ve used the classic menu engineering matrix (Stars, Plowhorses, Puzzles, Dogs), you already track popularity vs. margin. In 2025, the lever that moves those boxes fastest is imagery. On dine?in menus, QR menus, and delivery apps, photos set expectations in half a second. They make prices feel justified when styled to support placement, color, and anchoring.
Placement
- Dine?in printed: Eyes land in a “golden triangle” (top-center -> top-right -> mid-left). Put your top-margin item’s photo in one of those positions. Example: If your $18 “Citrus Salmon” contributes $9 and your $16 “Chicken Bowl” contributes $5, place the salmon image top-right. This menu engineering approach works well and can redirect 5-10% of orders.
- Delivery apps: The first row of tiles and the first image in a carousel get outsized attention. Make your hero item the first tile and the first carousel photo.
Color and Contrast
- Warm tones (golden browns, reds) amplify comfort foods; greens signal “fresh” for salads. A golden, backlit fried chicken sandwich will look crisper than the same item on a gray tabletop. In a hypothetical test, a warm background boosted add?to?cart by 8-12% vs. cool gray for a comfort dish.
- High contrast edges (glistening sauce highlights, crisp lettuce) help at thumbnail sizes on delivery apps.
Anchoring
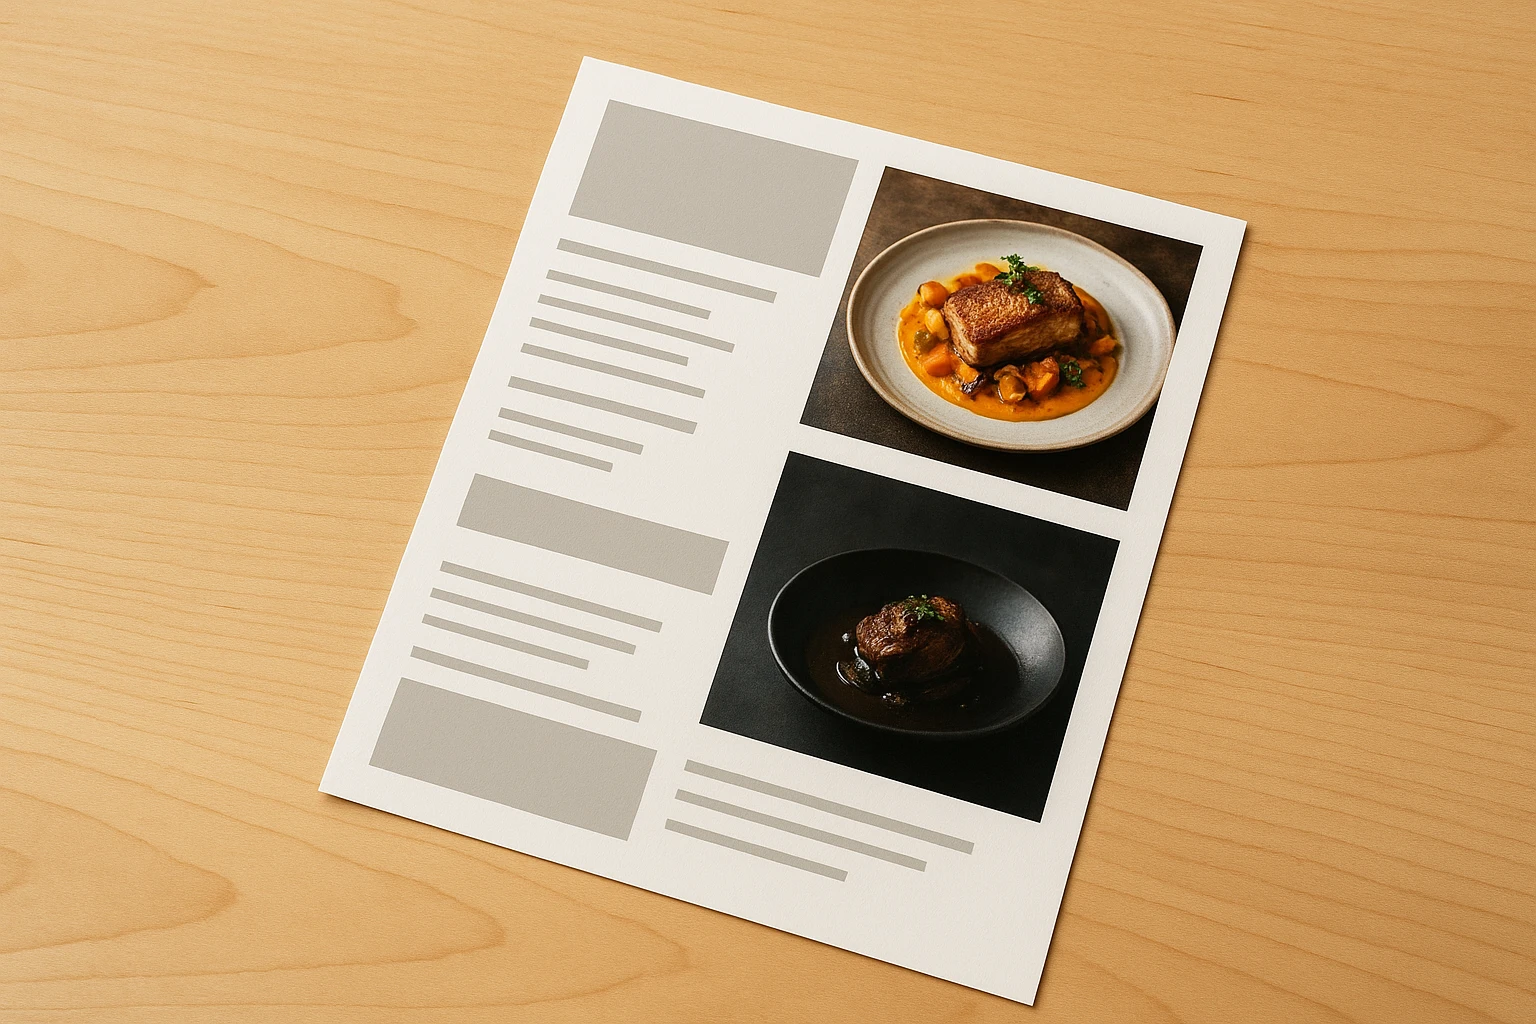
- Show a luxury item with a premium?styled photo as the price anchor. Next to it, your target item looks like smart value. Example: A $29 ribeye photo (dark, moody, dramatic) makes the $21 short rib bowl (margin +$8) feel like a deal. A 3-6% shift in orders toward the bowl at 500 covers/week adds ~$120-$240/week in contribution.
Key takeaway: Decide your winner first (by contribution margin), then engineer the photo, placement, and context to make that winner the obvious choice.
Summary: Use placement, color, and price anchoring with purpose-built photos to steer attention to your most profitable items across dine-in and digital menus.
Why Traditional Menus Leave Money on the Table
Most restaurants still rely on photoshoots every season-or skip photography altogether. Both approaches make testing impractical.
- Cost/time block real testing: A typical shoot is $150-300 per dish plus $500-1,000 per session. For 15 dishes, you’re at $3,000-6,000 and 2-4 weeks lead time. If you want three variants of your best-seller to test background color or angle, the budget doubles or you abandon testing. This is where AI food photography removes the cost barrier.
- Inconsistent imagery: Multi?unit groups often have slightly different photographer styles by city. That inconsistency weakens brand recognition and the subtle nudges you need for anchoring and placement to work.
- Seasonal misses: A fall LTO that needs photos by Oct 1 often posts Oct 20. By then, staff already pivoted to holiday prep. This lag kills A/B learning.
- Delivery app realities: App grids compress photos to small tiles. Without deliberate contrast, fine details disappear. Also, apps favor frequent updates-weekly test cycles outperform quarterly overhauls. Traditional shoots aren’t built for weekly iteration.
Concrete examples:
- Hypothetical: A burger concept wants to test a sesame?seed close?up vs. a cross?section melt shot. Scheduling a reshoot adds two weeks and ~$1,200 for a stylist and retouching-so they never test.
- A 4?location taco group prints one menu for all stores. The downtown location has a higher ribeye price due to rent. But the menu shares the same photos and anchors, weakening willingness to pay in the high?rent store.
Bottom line: If your photos can’t change fast, your menu psychology stays theoretical. You need images you can iterate weekly-ideally, within minutes.
Summary: Traditional photography makes A/B testing too costly and slow, which prevents you from applying placement, color, and anchoring where they matter most.
Using Yummify to Apply Placement, Color, and Anchoring
Here’s a practical workflow to make menu engineering measurable using Yummify’s AI?styled photos.
Step-by-step
- Pick 3 high?margin targets. Pull your POS mix and contribution margins. Example: Short Rib Bowl (+$8), Crispy Cauliflower (+$6), Key Lime Pie (+$5).
- Create a branded environment. Save your lighting palette and backdrop once (e.g., “Warm Casual: maple table, soft backlight, shallow depth of field”). This keeps dine?in, QR, and delivery visuals consistent.
- Generate 3-5 variants per item. Use Prompt Enhancement to describe plating, garnish, and angle. Example inputs: “overhead, glossy glaze highlight, warm tone”; “45? angle, clean white plate, high contrast greens.” Generation completes in minutes.
- Design for channel:
- Dine?in: One hero image per section. Use a premium decoy photo to the left of your target item to set the price anchor.
- Delivery apps: Bright, clean backgrounds; tight crops; overhead or 45? angle to survive thumbnail sizes. Make the high?margin item the first tile to improve delivery app conversion.
- QR menus: Use consistent color bands for categories for QR code menus; place the profitable item at top of its category with the photo slightly larger.
- Launch tests. Run each variant for 3-7 days. Track item mix and add?to?cart rates.
- Upgrade winners. Use Quality Upgrades to export the best performers at higher resolution for long?term use.
Example
- A ghost kitchen generates 12 images (3 items ? 4 styles) at standard quality in under an hour. After two one?week tests, they upgrade the best 4 images for permanent use and archive the rest.
Result: You’re finally testing placement, color, and anchoring as variables-not stuck with one expensive photo per dish for a whole season.
Summary: Use Yummify to spin up branded, testable photo variants in minutes and apply placement, color, and anchoring tactics across dine-in, QR, and delivery.
3 Mini Case Studies: Dine?In, Delivery, QR Menus
These are realistic, hypothetical scenarios that mirror what we see with operators using weekly image iterations.
1) Dine?in pizzeria uses a decoy anchor
- Goal: Push orders from a low?margin Margherita (+$3) to a Prosciutto Arugula (+$7).
- Tactic: Add a premium $28 “Truffle Pie” photo (dark, moody styling, slate board) as the anchor. Place it next to a warm, bright Prosciutto photo positioned top?right on the menu page. This menu engineering approach uses the decoy effect.
- Outcome: Over four weeks at 900 covers/week, Prosciutto’s share moves from 14% to 17% (3?point gain). Added weekly contribution: ~900 ? 3% ? $7 ? $189.
2) Delivery burger concept optimizes tiles
- Goal: Lift add?to?cart for the “Double Smash” (+$6 margin) on DoorDash.
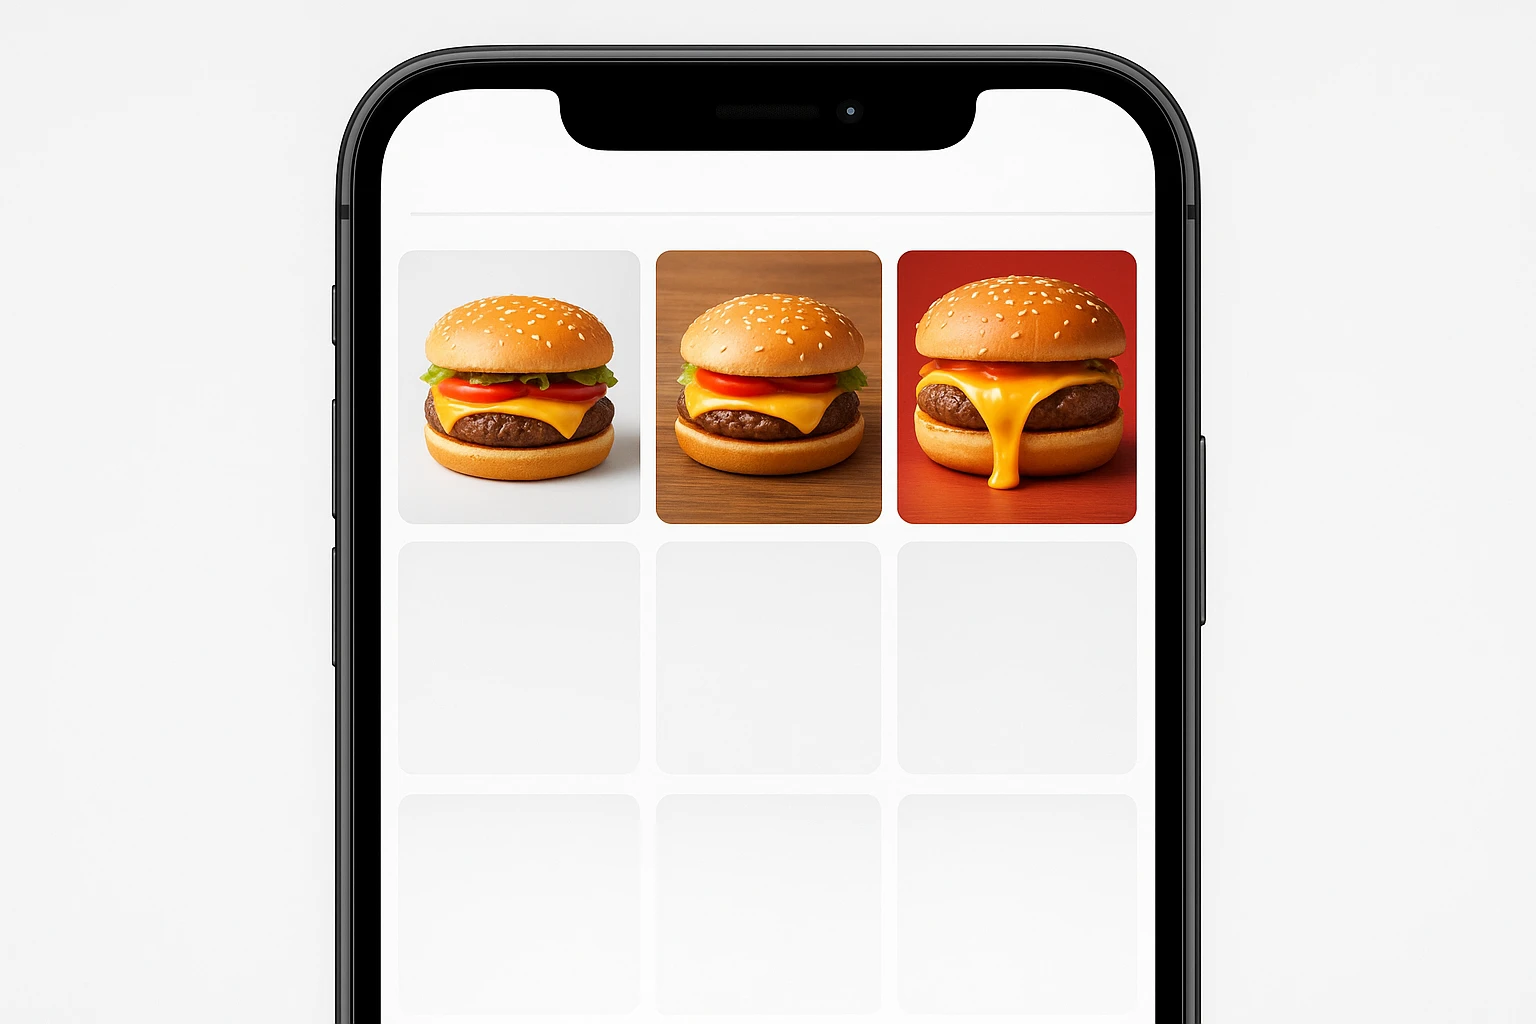
- Tactic: Generate three tile styles in Yummify-(A) bright white background, overhead; (B) warm wood, 45? angle; © bold red gradient, tight crop on cheese pull. Rotate each for 5 days.
- Outcome: Hypothetical results-B drives +14% CTR and +11% add?to?cart vs. A; C trails CTR but boosts conversion among viewers. Net, weekly contribution increases ~$340 at 750 orders/week.
3) QR ramen bar applies color and placement
- Goal: Nudge from Shoyu (+$4) to Spicy Miso (+$7).
- Tactic: In the QR menu, place Spicy Miso as the first item with a warm, chili?forward image; Shoyu appears second with a cooler, neutral-toned image. A small “chef’s favorite” tag sits under Spicy Miso.
- Outcome: Share shifts from 22% to 29% over two weeks. With 600 bowls/week, that’s +7% ? 600 ? $3 extra margin ? $126/week.
Common thread: The photo style supports placement and price framing. None of these required a reshoot; each test used 3-4 AI?styled variants created the same afternoon.
Summary: Three realistic examples show how image styling plus placement and anchoring shift order mix toward higher-margin items across channels.
14?Day Implementation Plan + A/B Test Recipes
Here’s a concrete sprint you can run without disrupting operations.
Day 1-2: Prep
- Pull last 6-8 weeks of POS mix. Rank items by contribution margin. Pick 3 targets.
- Decide anchors: choose one premium decoy photo per category (e.g., Tomahawk steak) to set price expectations.
Day 3-4: Create images in Yummify
- Build one branded environment to lock tone/lighting.
- For each target, generate 3-5 variants: overhead vs. 45?, warm vs. neutral backgrounds, tight crop vs. full plate. Use Prompt Enhancement for garnish and lighting detail to highlight high-margin menu items.
Day 5-11: Run channel-specific tests
- Dine?in (printed/board): Place the hero photo in the golden triangle; position the decoy anchor near the target’s listing. Track item mix daily.
- Delivery apps: Rotate tile A/B/C by daypart (lunch vs. dinner) for 3-5 days each. Track impressions, CTR, add?to?cart, and conversion. The menu engineering results speak for themselves after consistent testing.
- QR menu: Put the high?margin item first in its section with a larger photo. Use color consistency for category cues.
Day 12-14: Decide and scale
- Pick the winner per channel and upgrade those images to high resolution. Roll out to social and email for reinforcement.
A/B recipes to try now
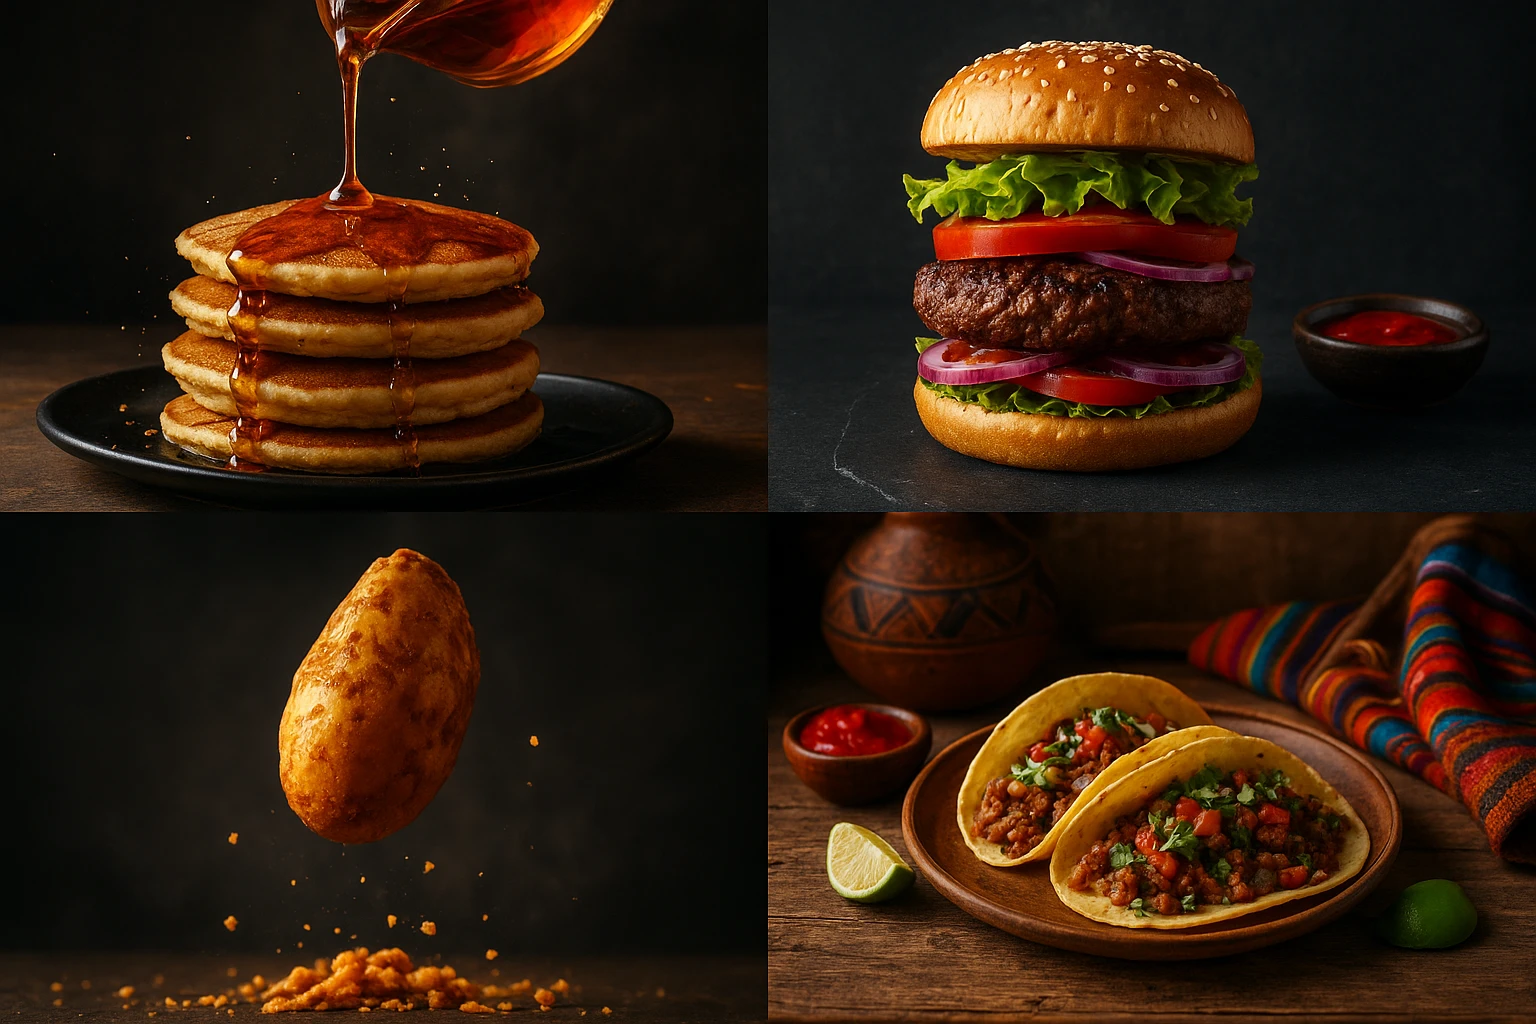
- Comfort dish: warm background vs. cool background; glossy highlights vs. matte finish.
- Salad: overhead with vibrant greens vs. 45? angle with crisp shadow.
- Burger: cross?section cheese pull vs. stacked profile.
Avoid these pitfalls: changing price mid?test, switching copy and photo at the same time, testing during holidays, or comparing weekends to weekdays. Keep one variable per test and stable time windows to ensure your menu engineering data stays clean.
Summary: Run a 14?day plan: pick targets by margin, create 3-5 image variants in Yummify, test by channel, then scale the winners and avoid common testing mistakes.
Next steps
Run a 14?day profit sprint. Pick three high?margin dishes, generate 3-5 AI?styled variants per item in Yummify, and test them across dine?in, QR, and delivery. Start with standard quality to keep costs near zero, then upgrade only the winners for long?term use. You can brief your branded environment once and apply it everywhere-menu, tiles, Instagram. Check plans at /#pricing and spin up your first images from /#hero. If you’ve wanted to test placement, color, and anchoring for years but the photoshoot budget blocked you, this is your low?risk path to proof. Try Yummify free
FAQ
Can I use my own photos as inputs for Yummify?
Yes. Upload a reference photo from your phone and Yummify will validate it’s food, then restyle it. For best results, shoot near a window in daylight, avoid harsh overhead light, and keep the dish centered. You can also generate from a text prompt if you don’t have a decent photo yet. Many operators do both: quick phone photo for structure, then style variations from text.
How does this compare to hiring a photographer for A/B testing?
A traditional shoot often runs $3,000-6,000 for ~20 dishes and takes 2-4 weeks. Generating 3-5 variants per dish for testing becomes cost?prohibitive, so most teams never test. With Yummify you can create dozens of variants in one afternoon at a fraction of the cost, then upgrade only winners. Keep using photographers for marquee campaigns or hero shots, and use AI images for weekly iteration.
What if my cuisine is hard to photograph (soups, stews, brown foods)?
Use prompt details that add texture and structure: oil glisten, steam, contrasting garnishes, and side props like toasted bread. Branded environments let you lock in a warm tabletop or neutral bowl that flatters the dish. Generate both overhead and 45? angle versions and test which survives thumbnail sizes better. Many brown foods benefit from a bright herb garnish and backlight highlights.
Do I need special equipment or design software?
No special gear is required. A recent smartphone is fine for reference photos, and Yummify handles styling and lighting in the generation step. You can export images and drop them into your menu files, QR builder, or delivery app dashboards. If you need higher resolution for print after testing, use the Quality Upgrade on the winning images.
How long does it take to learn and produce a full test set?
Plan for 30-45 minutes to define your branded environment and generate your first batch. After that, spinning up 3-5 variants per dish takes minutes. A team can create 12-20 images in a single afternoon, run a 1-2 week test, and decide with data. The key is measuring item mix or add?to?cart so you can pick winners confidently.
How do I measure impact for dine?in vs. delivery vs. QR menus?
For dine?in, compare item mix before/after by daypart and day of week using your POS. For delivery, pull impressions, CTR, add?to?cart, and conversion in your app partner dashboards. For QR menus, tag menu versions and track order mix from tables using that code. Keep tests at least 3 days, avoid holidays, and change one variable at a time to isolate the effect.
Related posts
15 Creative Food Photography Ideas to Make Your Dishes Stand Out
Discover creative food photography ideas to make your dishes stand out. Learn action shots, deconstructed dishes, unique angles, storytelling, and AI tools for stunning food visuals.
Beyond Burgers: AI Food Styling for Diets and Cuisines
Use AI food styling to create accurate vegan, gluten-free, halal, kosher, and global cuisine photos that convert across delivery apps, QR menus, and social.
Close the Loop: Tie Food Imagery to Analytics and Sales
Stop guessing which food photos work. Learn a simple workflow to tie Yummify images to analytics, A/B test visuals, and promote only the photos that actually sell.